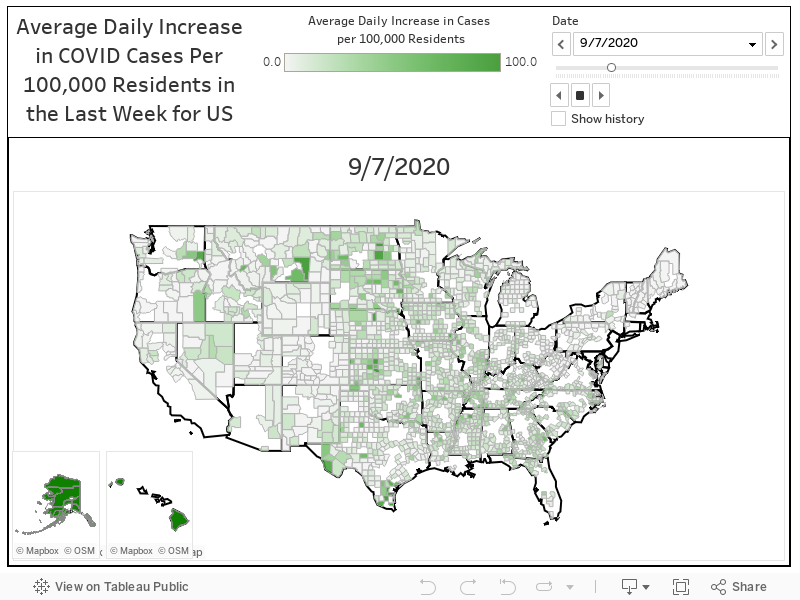
COVID-19 Growth in Rural Counties
This map shows the change COVID-19 cases in the 7 days preceding the date displayed. Cases are displayed using per capita numbers for all non-metro counties. Press play in the top right corner to see the impact of COVID-19 over time. Darker green signifies sharper increases in cases per capita. COVID-19 case data is collected from USA Facts daily and converted to per capita cases using the 2019 American Community Survey population estimates. This analysis was conducted by the NC Rural Health Research Program.