Rural and Urban COVID-19 Hot Spots
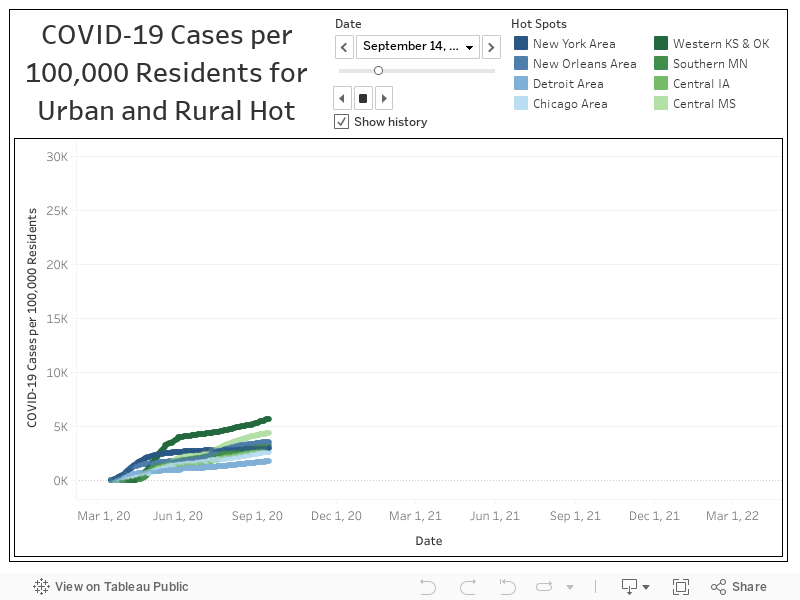
This chart shows the COVID-19 cases per capita curves for selected rural and urban hot spots. Urban hot spots are shown in blue and rural in green. Press play in the top right corner to compare how COVID-19 has impacted rural and urban hot spots over time. COVID-19 case data is collected from USA Facts daily and converted to per capita cases using the 2019 American Community Survey population estimates. This analysis was conducted by the NC Rural Health Research Program.