Rural COVID Research and Figures
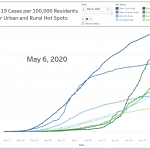 |
Rural and Urban COVID-19 Hot Spots As the virus spreads, some areas become epicenters and undergo rapid increases in cases. Typically, these are presented in absolute case counts. Per-capita rates better capture the relative stress on the area, especially in rural areas which may have fewer resources. This chart compares per-capita rates in various rural and urban hot-spots of note. |
| COVID-19 Growth in Rural Counties
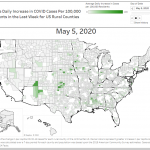
This map shows the growth in per-capita case rates for nonmetro counties across the United States. This allows readers to identify rural areas where cases are growing especially rapidly. |
|
| State Rural Hospital and Community COVID-19 Vulnerability
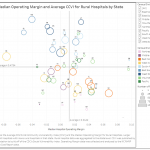
Some communities are less resilient to COVID-19 than others. Here, we compare the state averages for the Vulnerability Index (as calculated by the Surgo Foundation) to the median operating margin for rural hospitals in the state. Southern states are more vulnerable and have lower profitability hospitals. |
|
|
Occupancy Rates in Rural and Urban Hospitals: Value and Limitations in Use as a Measure of Surge Capacity
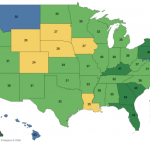
In an early brief, we present data on historical occupancy rates for acute and ICU beds for metro and non-metro hospitals in each state. |
|
|
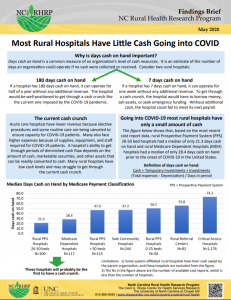
Most Rural Hospitals Have Little Cash Going into COVID
Using the financial indicator “days cash on hand,” this infographic shows the type of rural hospitals most likely to struggle financially during the pandemic |
You must be logged in to post a comment.